Museums, the reality behind the ads: gap widens between large and small, payers grow little, tickets never so expensive
2018 was the year that set visitor and revenue records for our state museums (in fact, never had such high numbers been recorded : 55 million people flocking to cultural venues and 229 million euros in revenue), but if you want to analyze the data in depth, you cannot help but notice that last year also touched some negative records: now, it is not intended to take anything away from the good results achieved, but in order to understand them in depth and to understand the direction in which our museums are heading, it is incumbent and necessary to examine with due attention the ways in which these numbers were achieved. We welcome the fact that more and more people are deciding to visit our museums, and with the same welcome we welcome the news of receipts that, for the first time, exceed 200 million euros: however, these figures conceal a reality with which it is necessary and urgent to measure ourselves in order to correct dangerous trends that, in the long term, could damage our museums.
We can start with the number of visitors: in 2018 there were 55,504,372, compared to 50,169,316 in 2017 (for the 2017 figures we used the latest tables released MiBAC, which have downward adjustments in comparison to those, referring to the same year, found on the website of the Statistics Office): a year-on-year increase of 10.63 percent, and to find a similar increase it is necessary to go back to 2011, when it went to 41 million from 37 the previous year. The seemingly extraordinary figure is dwarfed when one considers that the increase came mainly from non-paying visitors. This year there were 24,938,547 paying visitors, up from 24,062,122 in 2017: the increase, in this case, was 3.64 percent, by far the worst figure in the last five years (and thus also in the entire post-reform period). There were just under nine hundred thousand more payers between 2018 and 2017, while since 2013 the increases were all in six figures (last year alone, payers were a million and a half more than in 2016). For just under nine hundred thousand more paying visitors, we had four and a half million more free visitors. Since we have data on the numbers of visitors to free museums and those who visited paid museums for free, it is interesting to further refine the analysis.
In absolute terms, we had 11,442,864 visitors who entered sites that are normally visited for free, and 19,122,961 visitors to free sites: in 2017 there were 10,940,882 and 15,166,312, respectively. The increase in free visitors to fee-paying museums is one of the highest in recent years: we are at 4.58 percent, and in the last decade better results than this year were touched in 2017 (with an 11.56 percent increase compared to 2016), in 2014, the year free Sundays came into force (+9.45 percent) and in 2010 (+5.9 percent). And it should be noted that, just since 2014, there have been three out of five occasions during which the increase in non-payers exceeded the increase in payers: perhaps it is safe to assume that a large part of the public waits for free days to go to the museum. However, in the absence of more in-depth surveys of museum audiences (composition, preferences, modes of visitation, and so on), which are most urgent, which would be extremely useful in finding effective management models, and which insiders have been demanding for years now, we can only move in the realm of hypotheses.
Another interesting figure is the number of visitors to free sites, which showed a considerable increase over 2017, with visitors even increasing by 3,956,649 (+26%). A further step can be taken, however, because if we look at the data by individual museum, it will be possible to see that the bulk of the increase is concentrated exclusively on three sites (the Pantheon, Capodimonte Park and the Victor Emmanuel II Monument at the Vittoriano), which alone added up to an impressive 3,683,979 more visitors: that is, 88 percent of the increase (a total of 4,151.983 visitors, from which, in order to obtain the net balance, it is necessary to subtract the decreases in museums that experienced declines in visitors) is concentrated exclusively on three places, while the other dozens of museums where you do not pay a ticket share only about 12 percent of the sum: in absolute terms, this is an increase of about 470,000 visitors, for a net balance of just over 270,000 (to give a term of comparison, the net balance of free museums is equivalent to the number of visitors to the Abbey of Montecassino or the Blue Grotto of Capri). The increases are distributed a little better among paid museums. Here, 876,425 more visitors were recorded: however, the total increases were one and a half million, distributed 75 percent over the top five institutions.
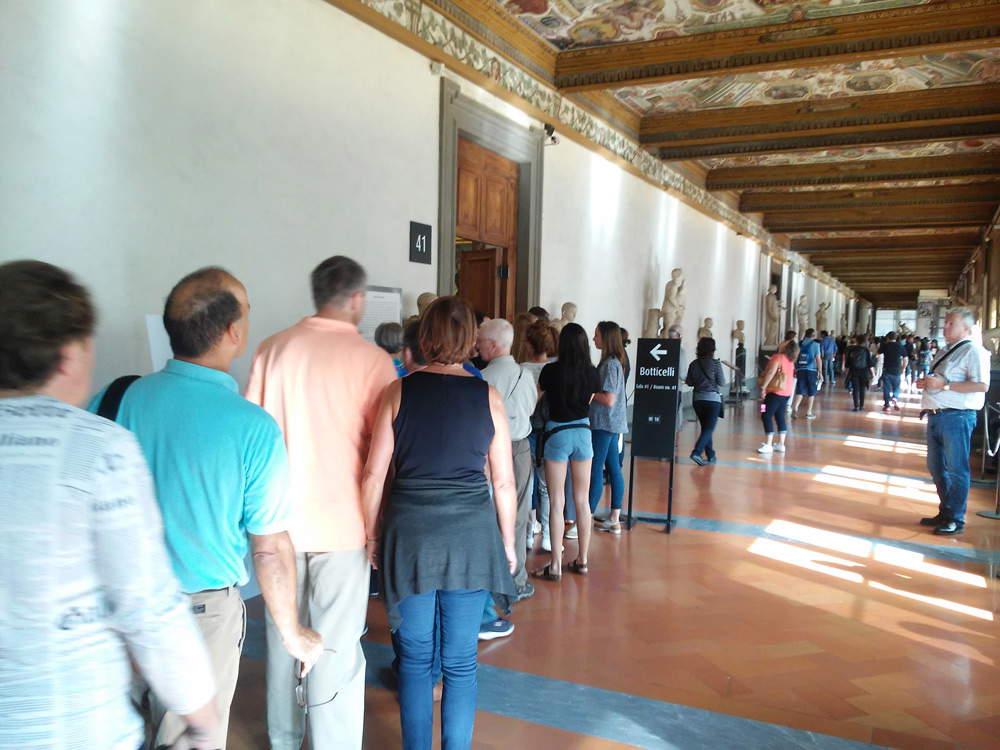 |
| Uffizi Gallery, the queue to enter the Botticelli room. |
Of course: one could make an objection and say that it is normal that the greatest increases concern the most visited sites. To better frame the figure, therefore, a further analysis is needed that takes into account the percentage of visitors to the most visited museums in relation to the overall total. In this sense, it is possible to carry out an exercise that should provide a more complete idea: assessing the weight of the thirty most visited museums in relation to the total of all Italian museums and analyzing their trend on an annual basis. In its “top 30,” the MiBAC excludes the Pantheon, which historically, given its location and the fact that you can enter it for free, has almost always been the most visited site (however, since there are no longer attendance records, the number of visitors is calculated through sample statistics): however, since the 55 million total includes the Roman site, we will take it into account for our examination. This year, visitors in the “top 30” were 43,763,143, compared to 38,508,045 in 2017, 32,810,730 in 2016, and 30,879,202 in 2015. In contrast, we had 11,745,882 visitors to “smaller museums” (we will call this, for convenience, all sites that ranked above 31st in the rankings) in 2018, compared to 11,661,271 in 2017, 12,573,143 in 2016, 12,912,960 in 2015, and 12,585,456 in 2014, to 14,317,891 in 2011. The percentage of visitors to museums outside the top 30 compared to the total in 2018 was the lowest in the past decade, and the number has been steadily declining, especially since the reform: if between 2011 and 2014 it had stabilized at around 30 percent, since 2015 it began to drop steeply, touching 29.48 percent in 2015, 27.70 percent in 2016, 23.24 percent in 2017, and even 21.15 percent in the 2018 surveys. Never had the result been so low.
Again, a further step can be made by calculating the average number of visitors, given the total number of museums covered by the statistics. There was a slight increase compared to 2017, but we are far from previous years, while, on the contrary, the “top 30” continue to experience very marked increases. The average in the top 30 museums this year was 1,458,772 visitors, compared to 1,283,601 in 2017 (a 13.64 percent increase, the second best ever after 2017: then, it was 17.36 percent), while the other 453 museums where at least one visitor was seen averaged 25,918 visitors, compared to 25,461 in 2017 (just +1.79 percent). We are a far cry from the pre-reform years, when the gap between “large” and “small” museums was much less pronounced: in 2013, the average in small museums was 28,783 visitors, and even in 2011 it reached 35,705 visitors (compared to 896,858 in the top 30: at that time, there were 401 “smaller” museums). Basically, last year’s trend is confirmed: mostly large museums are growing, while area museums are struggling to keep up. Therefore, it is believed that in the future the ministry will have to take action to reverse the trend: on the contrary, smaller museums will be less and less visited, and consequently less relevant, and for many this could mean closure.
Finally, one last note concerns receipts. It is true that this year’s 229,360,234.78 euros is a record figure, never reached before, but this result was possible because 2018 also set an all-time record for the average ticket price increase. If in 2017 an average of 8.05 euros was paid to enter state museums (and already last year the 8-euro wall was surpassed for the first time in history, with the third highest year-on-year increase ever), this year even more was done and 9 euros were surpassed: visitors to Italian state museums this year paid an average of 9.19 euros to cross the thresholds of cultural venues, with a year-on-year increase of 14.12 percent (other than inflation of about 1 percent). It is the largest increase ever, higher by more than three percentage points than the one recorded between 2002 and 2001, at the changeover from the lira to the euro (then the average ticket cost 5.70 euros compared to 5.14 the year before, with appreciation of 10.83 percent). And it earned MiBAC’s coffers nearly 30 million euros: after all, to compensate for the fact that MiBAC’s media campaigns are overbalanced on free Sundays, a ready remedy must be found. Too bad it was found on the skin of those who do not wait for the first Sunday of the month to visit a museum.
Warning: the translation into English of the original Italian article was created using automatic tools. We undertake to review all articles, but we do not guarantee the total absence of inaccuracies in the translation due to the program. You can find the original by clicking on the ITA button. If you find any mistake,please contact us.
