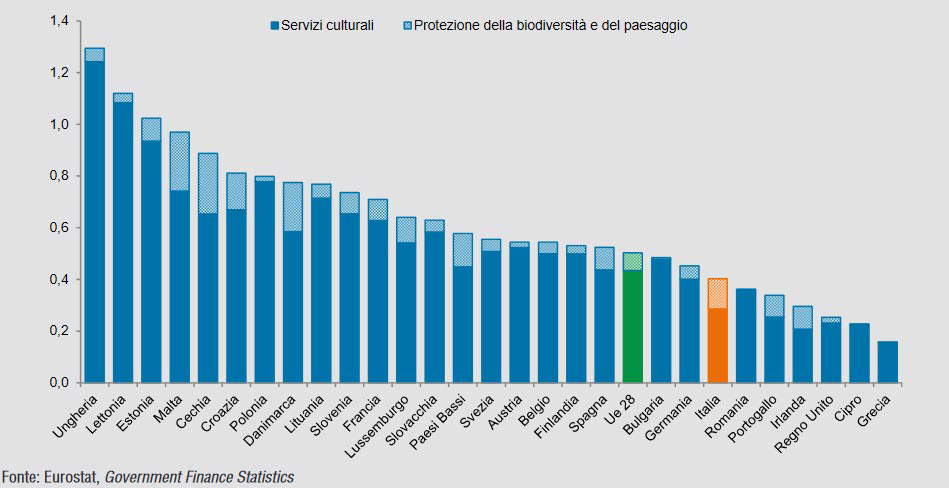
The public spending thatItaly reserves for culture is among the lowest in Europe. This is affirmed by the 2021 edition ofIstat’s BES (Benessere Equo e Sostenibile) report. On public spending, which includes activities for the protection and enhancement of heritage, the data refer to 2018: we are talking about 5.1 billion euros, few compared to what France and Germany spent (14.8 and 13.5 billion respectively) but less even than Spain, which allocated 5.3 billion to culture. In relation to Gross Domestic Product, Italy spends just 2.9 per thousand, compared to 4 per thousand for the European Union average. The figure puts us, in this particular ranking, in 23rd place out of 28 member states (worse than us are only Romania, Portugal, Ireland, the United Kingdom and Greece, while the top five places in the ranking are occupied by Hungary, Latvia, Estonia, Malta, the Czech Republic and Croatia, as seen in Fig. 1). On the upside, there is some good news: we are the country that spends the most on biodiversity and landscape protection (2.9 billion compared to France’s 1.9 billion and Germany’s 1.7 billion), although the sum has decreased by 23 percent since 2010.
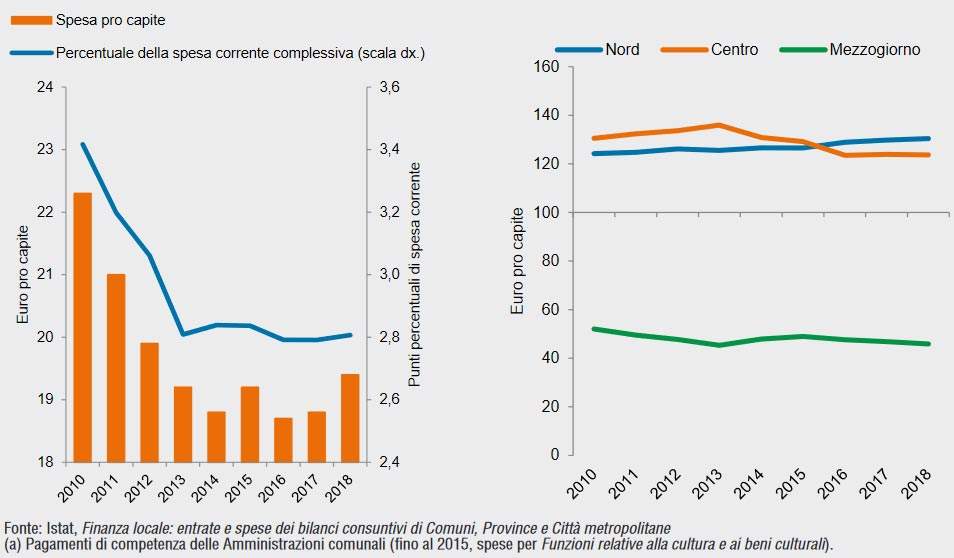
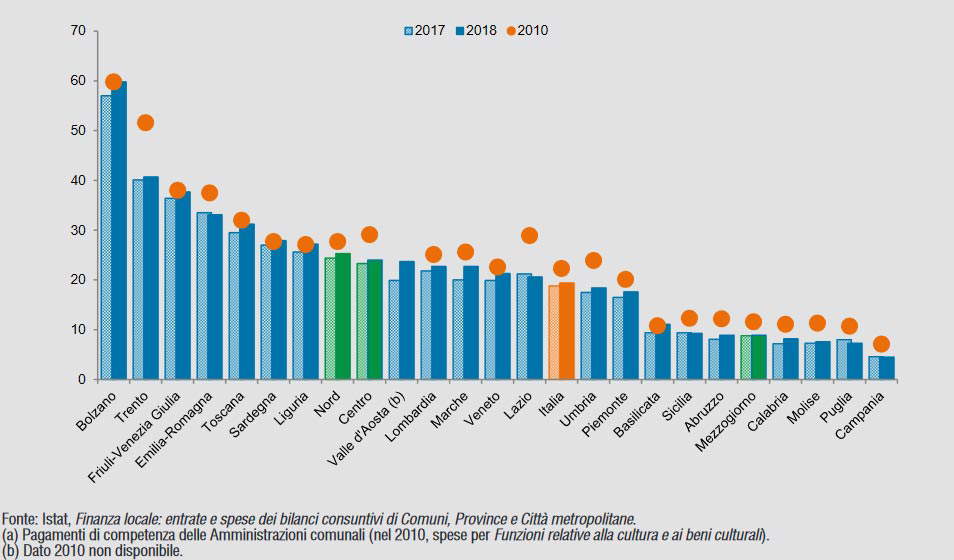
The report also examines municipalities’ spending on the management of cultural goods and activities: 19.4 euros per capita in 2018, 0.6 euros more than in 2017, but 2.9 less than in 2010 (a 10 percent drop from eight years earlier, compared with 8.5 percent growth in complssive current spending). In municipal budgets, Istat points out, the culture budget fell from 3.4 percent to 2.8 percent of current spending between 2010 and 2013 and has remained stable since then (Fig. 2). Then the gap between the North-Center and the South continues to widen: in 2018, a municipality in the South spends an average of 8.9 euros per capita on culture (45.9 percent of the Italian average and just over one-third of a municipality in the North-Center), while in 2010 it spent 11.6 euros (52 percent of the Italian average and about 40 percent of municipalities in the North-Center). In the interregional comparison, very marked inequalities are observed: from 4.5 euros per capita in Campania to 33.1 in Emilia-Romagna, among regions with ordinary statutes, and from 9.3 euros per capita in Sicily to nearly 60 in the province of Bolzano among regions and autonomous provinces. The five regions where spending is highest are Province of Bolzano, Province of Trento, Friuli-Venezia Giulia, Emilia-Romagna and Tuscany, while those where spending is lowest are, from the bottom of the ranking, Campania, Puglia, Molise, Calabria and Abruzzo (fig. 3).
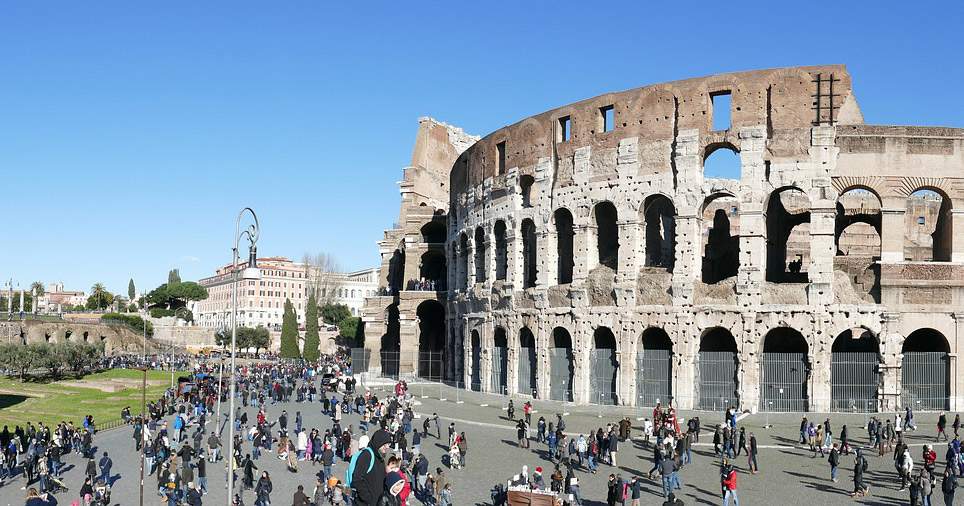
Again, on culture data, Istat notes theincrease in museum attendance, especially in the south, but also the concentration of flows. In Italy there are 4,880 permanent exhibition facilities open to the public (1.6 per 100 square kilometers including museums and galleries, archaeological areas and parks, monuments and monumental complexes), which welcomed nearly 130 million visitors during 2019. Since 2015, however, the number of facilities surveyed has decreased (-1.9 percent). Istat also notes a continued increase in visitor flow (+17.5 percent, and +22.7 percent in the South), although growth in 2019 has slowed considerably compared to the previous year (+1 percent vs. +8 percent). Half of the visitor flow, however, is concentrated in1% of facilities, and attendance increases especially in the most important facilities (+33.5% in those with an average of more than 2,500 admissions per day). The indicator of museum heritage density and relevance shows a highly concentrated territorial distribution. Finally, there are only four regions, favored destinations for international tourism, that exceed the Italian average (1.62 facilities per 100 km2): Lazio, Tuscany, Campania and Veneto (fig. 4).
“While the increase in attendance is in itself a positive fact (and particularly encouraging for the South),” Istat notes, “the trend toward concentration of flows is less so, as it risks becoming unsustainable for the major poles of attraction of cultural tourism and calls for a rebalancing strategy.”
 |
| Fig. 1. General government expenditure for class 05.4.1 of the International Classification of Government Expenditure by Function (Cofog) |
 |
| Fig. 2. Left: Current expenditure of municipalities for Protection and Enhancement of Cultural and Landscape Heritage and Activities (a). Years 2010-2018. Euro per capita and percentage values. Right: Per capita current expenditure of municipalities for Protection and Enhancement of Cultural and Landscape Heritage and Activities (a) by geographical breakdown. Years 2010-2018. Index numbers, Italy=100 |
 |
| Fig. 3. Current expenditure of municipalities for Protection and Enhancement of Cultural and Landscape Heritage and Activities (a) by region and geographical breakdown. Years 2010 and 2017-2018. Euro per capita |
 |
| Fig. 4. Density and significance of museum heritage by region and geographic breakdown. Years 2015 and 2019. Museum facilities weighted by the number of visitors per 100 km2. |
 |
| We are among the European countries that spend the least on culture. Istat's report |
Warning: the translation into English of the original Italian article was created using automatic tools. We undertake to review all articles, but we do not guarantee the total absence of inaccuracies in the translation due to the program. You can find the original by clicking on the ITA button. If you find any mistake,please contact us.